If you add New Business as a budgetable item, then it can be pulled into this report. This report allows you to compare your New Business Budget Totals against your New Business Accounts. The New Business Booked column is based off your New Business By Definition Standards set in Matrix.
If you add New Business any other way while budgeting it will NOT be tracked. This includes, but is not limited to, utilizing a specific Revenue Type, Account or other entity.
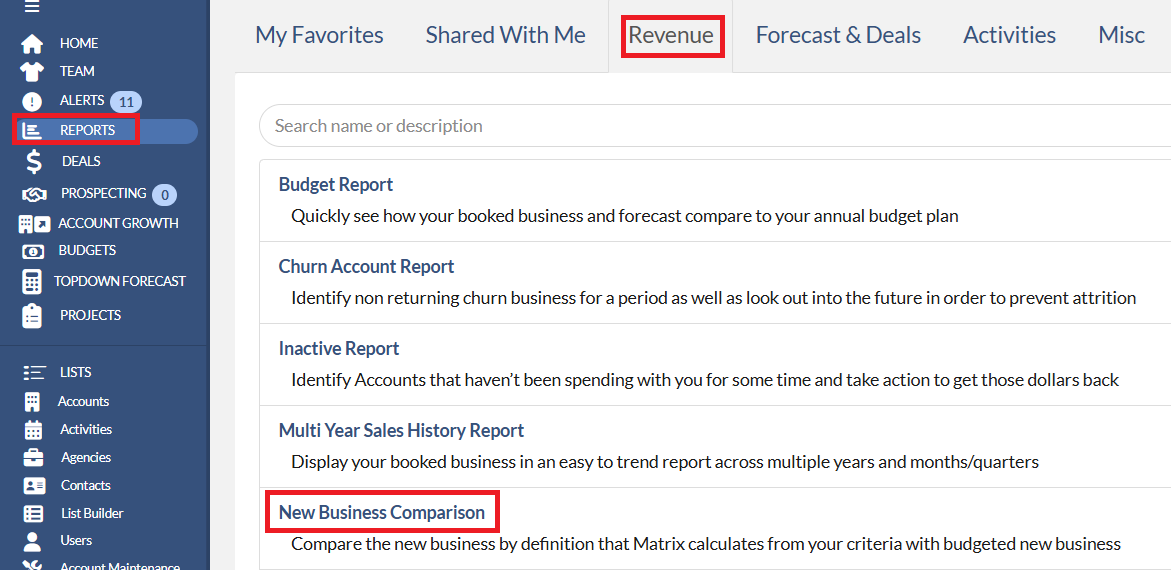
To create the New Business Comparison report, please follow the below instructions:
1. Please navigate to Reports on the menu bar.
2. Click the Revenue tab.
3. Click the New Business Comparison Report link.
On the Options screen, you will be presented with the below options to build your report.
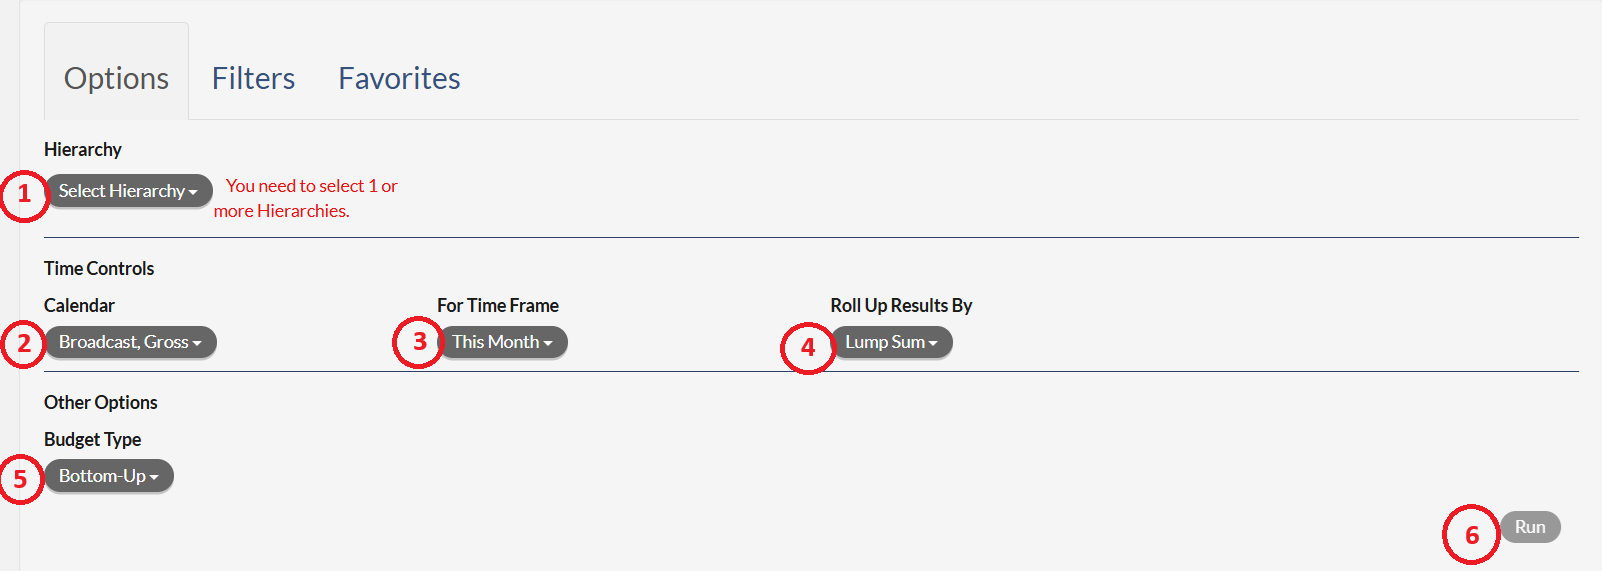
- Hierarchy Selection - in this drop-down you may select the attribute(s) that are to be on the report.
- Calendar Selection - in this drop-down you may select what calendar type the report will utilize.
- For Time Frame Selection - In this drop-down you may select the time frame of the report.
- Roll Up Results By Selection - in this drop-down you may select how you may want to roll up the results by a lump sum or by a time period, such as a month.
- Budget Type Selection - In this drop-down you may select the budget type, Top Down or Bottom Up, you wish to see.
- Run Button - once all options have been selected, clicking the Run button will run the report.
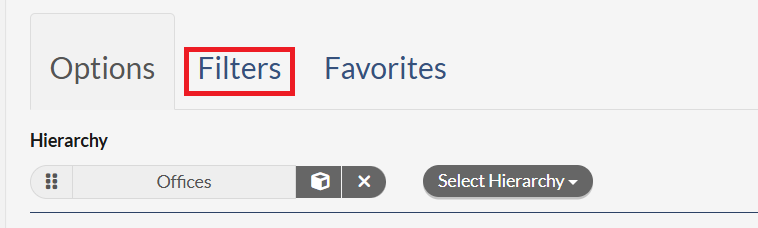
Note that you can click the Filters tab will allow you to select or not select various data points or groups within the report.
Once the report is run, the screen will display the report based on the Options and Filters selected. A view like the below will appear.
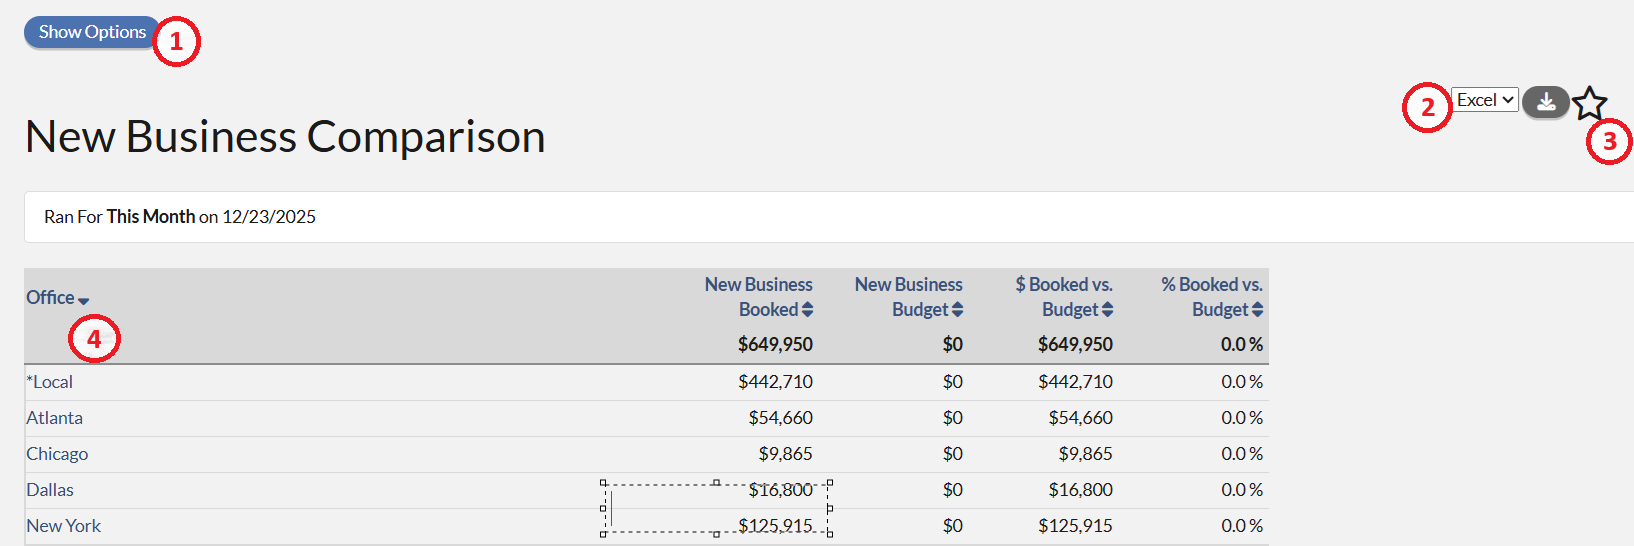
- Show Option - clicking this button will show the Options and Filters dialog to edit the report and allow you to re-run the report.
- Download - in the drop-down a user can select to export the data in either a .csv format or Microsoft Excel format. Clicking the icon next to the drop down will download the report in the selected format.
- Favorite Icon - clicking the Star icon will allow you to save the report has a favorite. Once saved as a favorite, the report can be shared to other users. Please click here for the instruction.
- Report Data - the table at the bottom of the screen is the data from the report. The New Business Comparison Report is formatted so that the hierarchy is on the far left, followed by a column for the New Business Booked, New Business Budget, $Booked vs. Budget and %Booked vs. Budget.
You must use the User Interface as a standard way of tracking your New Business Budgets to accurately build this report.
To add a New Business row to your Budgets, please click here for the instruction.