The Market Projects Report will show the the Pitched, Won, Lost, and Goal information for a project and how entities like Salespeople, Accounts, Offices, Outlets, and Revenue Types roll up into those metrics.
To create the Market Projects Report, please follow the below instructions:
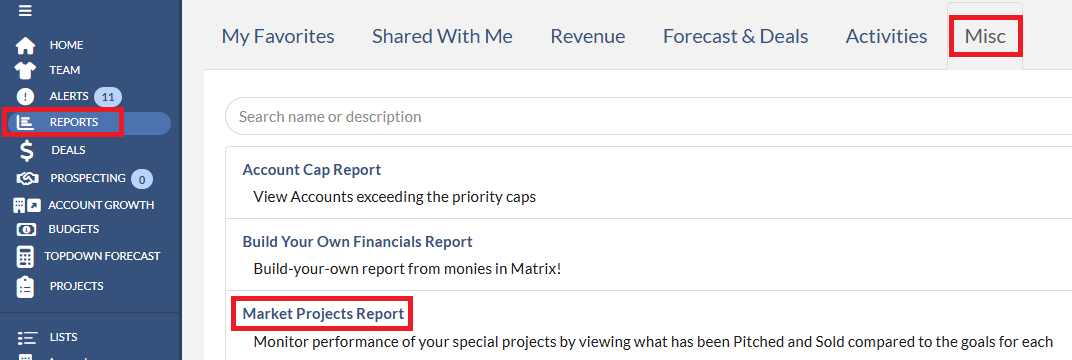
1. Please navigate to Reports on the menu bar.
2. Click the Misc tab.
3. Click the Market Projects Report link.
On the Options screen, you will be presented with the below options to build your report.
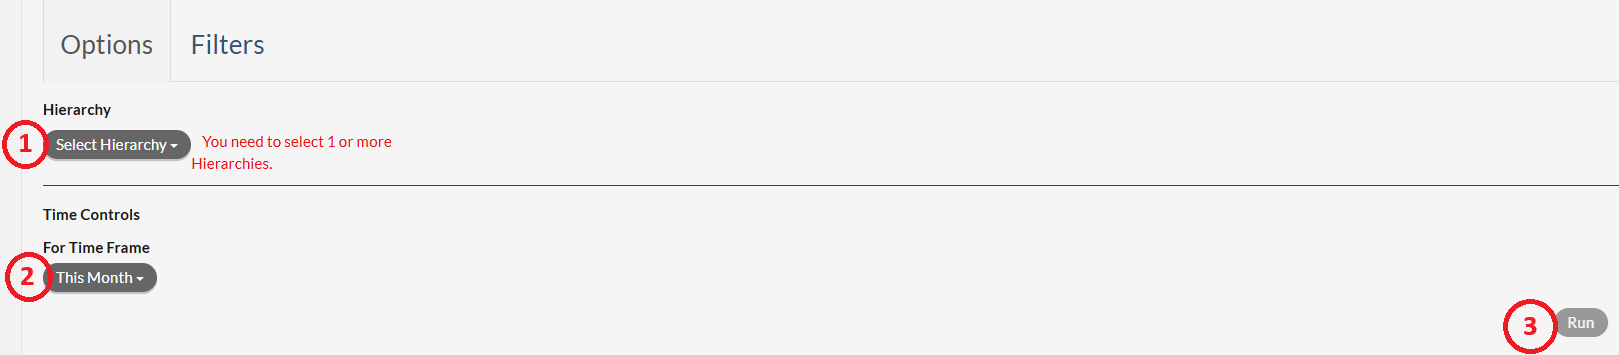
1. Hierarchy Selection - n this drop-down you may select the attribute(s) that are to be on the report.
2. For Time Frame Selection - In this drop-down you may select the time frame for Projects. If at least 1 date of the project falls within this time frame then you will see all of the information for that project.
3. Run Button - once all options have been selected, clicking the Run button will run the report.
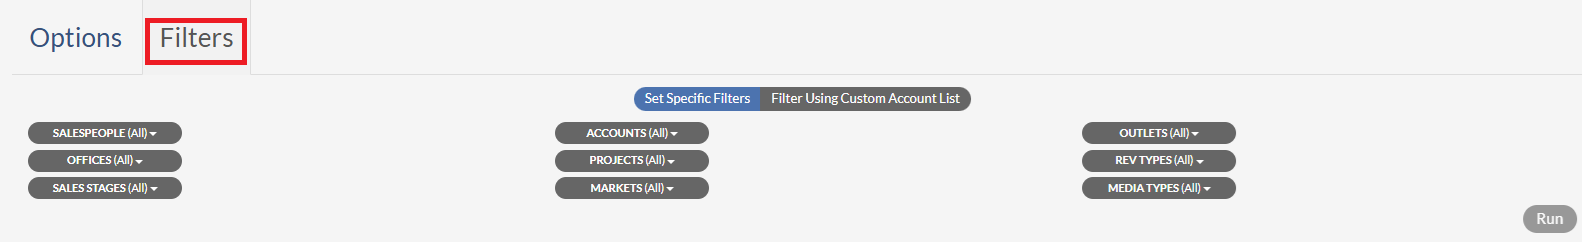
Note that clicking the Filters tab will allow you to select or not select various data points or groups within the report.
Once the report is run, the screen will display the report based on the Options and Filters selected. A view like the below will appear.
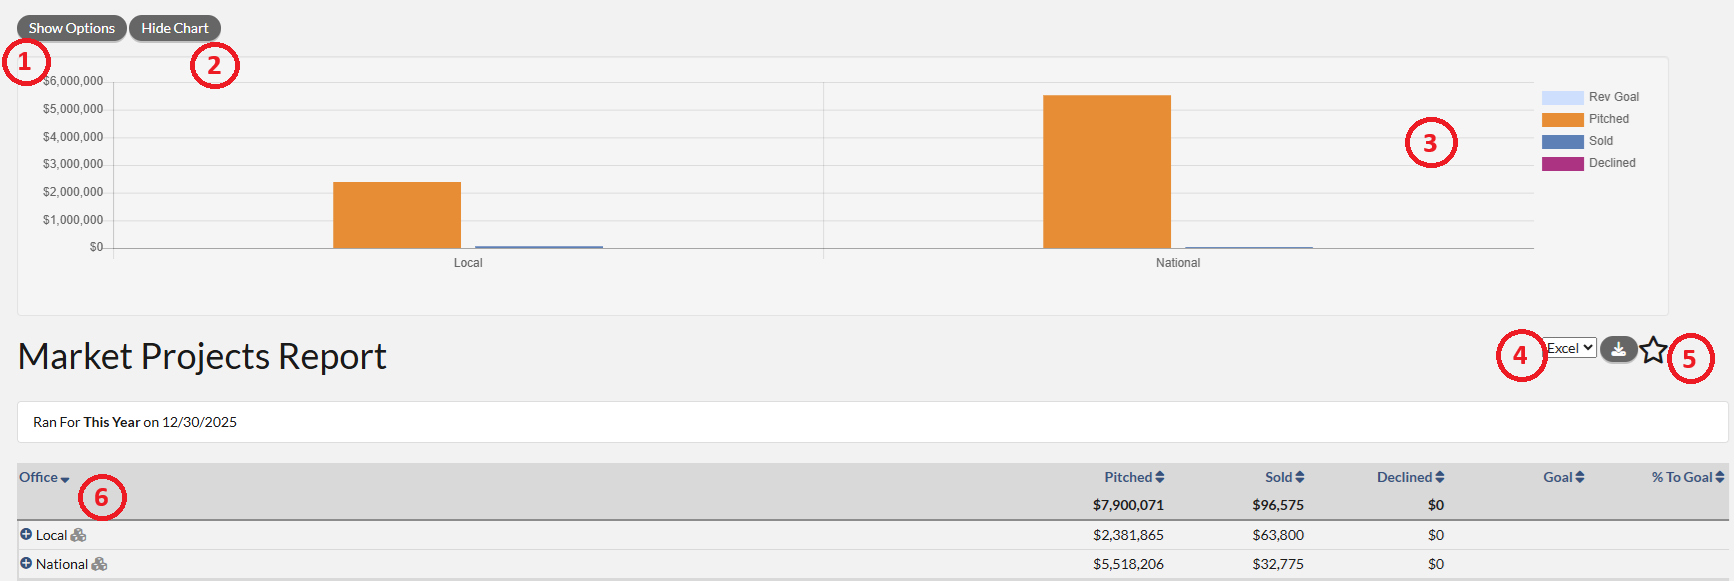
- Show Option - clicking this button will show the Options and Filters dialog to edit the report and allow you to re-run the report.
- Hide Chart - clicking this button will remove the chart from the view.
- Chart Field - the report will display a line chart showing the trending over the time frame that was selected.
- Download - in the drop-down a user can select to export the data in either a .csv format or Microsoft Excel format. Clicking the icon next to the drop down will download the report in the selected format.
- Favorite Icon - clicking the Star icon will allow you to save the report has a favorite. Once saved as a favorite, the report can be shared to other users. Please click here for the instruction.
- Report Data - the table at the bottom of the screen is the data from the report. The Budget Report is formatted so that the hierarchy is on the far left, followed by the following columns:
- Pitched - The dollar amount of pitched on the project for the timeframe selected.
- Sold - The dollar amount of sold on the project for the timeframe selected.
- Declined - The dollar amount of declined on the project for the timeframe selected.
- Goal - The dollar amount of goal on the project. Note that Goal information is only available at the Project level.
- %To Goal - Calculation of ((Sold) / (Goal)).